Carbuncle.Maletaru said: »
What are those %s supposed to represent, Nifl?
Treasure Hunter Proc Rate Testing -TH 8 Versus 14 |
|||||||||||||||||||||||||||||||||||||
|
Treasure hunter proc rate testing -TH 8 versus 14
Carbuncle.Maletaru said: » What are those %s supposed to represent, Nifl? TH15 should at worst be equal to TH8 that's why you need 5 trillion samples and why no one ever did it.
Very strange results, especially with TH15, but I suppose that's simply sample size. At bare minimum the eye opening result is how large the TH15 equipped spiked the chance to hit TH9... but then seemed even at best afterwards... I wonder how true that will remain as more samples come in.
I appreciate you condensing the findings a bit to be more digestible. Fenrir.Niflheim said: » Anyway can't wait for more data :) Asura.Eiryl said: » TH15 should at worst be equal to TH8 that's why you need 5 trillion samples and why no one ever did it. In this hypothetical, say you have the enemy tagged with TH 8, then wearing TH 9 or maybe even 8 would have the highest % chance at a proc, and further from the standard deviation, larger values, would decrease your chance of proc in turn. The current test #'s dont really show this, but that's a case in which TH15 COULD be worse than TH8 when attempting to proc TH8/9 Carbuncle.Maletaru said: » IE. 10% 12% 40% 33% 22% 57% = average of 29% If one person goes 1/10 on a drop, then another goes 1/50 on a drop, you would say they have a 6% chance of dropping (2% + 10% / 2) 2/60 is not 6%.
Fenrir.Niflheim said: » Here is what I would say the experiment thorny did showed.  I would TH8 could almost fit a theory of each TH level = +1% to your proc rate and after each proc that is cut in half. so ideally it would be 8%, 4%, 2%, 1%, 0.5%, 0.25%. Doing a null hypothesis for each value based on the data they are possible, with such high standard deviations and low sample sizes a lot of things are possible. But TH15 really doesn't support that theory much, TH9->10 is pretty far from the 7.5% that is would be under the theory and the standard deviation is only 3.02%. so we can be 99% certain that the real value is 3.96% +/- 1.887%, so between 2.073% and 5.847% Anyway can't wait for more data :) I don't think you've read what thorny's data showed right. Prelimarily (based on sample size) his data is showing htat TH15 gear has virtually the same rate of upgrade as TH8 gear. I don't know where you're getting the numbers in your table from. The Data provided so far really isn't nearly enough to draw any conclusions as to what the rate of upgrade is. The variance between 25th/50th/75th percentile of the data points is so wide you couldn't even guess to what the actual rates are for each level.
Edit: You'd generally want to use the median value to determine the actual rate of upgrade. And you'd need enough samples that that value likely would start repeating (aka it would be surrounded by the same value or very close. Edit: based on the median values of the current data set you'd get:
Carbuncle.Maletaru said: » Isn't averaging averages one of the top 5 sins of statistics? Carbuncle.Maletaru said: » If one person goes 1/10 on a drop, then another goes 1/50 on a drop, you would say they have a 6% chance of dropping (2% + 10% / 2) 2/60 is not 6%. The end target is to estimate the procrate, which is likely a flat rate, and yes, you'd want to use 2/60 if you had an immense amount of data to ensure accuracy. With what little data I've provided so far, the model Niflheim is using is 'number of hits until proc' and that provides independant samples, so a standard deviation and confidence interval can be established. This is a reasonable way to look at this data, because the confidence interval gives a numerically supported way to say how meaningful the data is. For example, with the TH8->TH9 while wearing TH15 sample.. the arithmetic mean is 26.9 hits to proc(3.7%). But, with a standard deviation of 31, the 95% confidence interval is 12.0132 (8.3%) to 41.8692(2.3%). So, we can be 95% sure that the chance of proccing TH8->TH9 while wearing TH15 is between 2.3% and 8.3%.. which is to say, there isn't enough data period. I do believe there is a major flaw in whatever methodology is producing her most recent table, if viewing the data as average hits until proc, then all factors need to be assessed in those terms prior to converting to a percent. Both models are basically trash until the dataset is expanded more, people want conclusions fast but it's just going to take time unless others get involved in providing high quality data to work from. But, Nif's model is a good way to evaluate just how accurate the current dataset is, because eventually the confidence interval will shrink to a reasonable value given enough data.
[+]


Set up a bit more testing for today, one character with TH5(+2 in gear) and one with TH8(+5 in gear) on seperate targets, but tweaked my tanks to start killing after 3 upgrades so I can get a higher density of data on the earlier procs. My hope is that the TH5 sample will show a similar curve from 5-8 as the TH8 samples show from 8-11, indicating against any significance to the TH level itself as opposed to the delta.
[+]
Just going to add a graphic to Thorny's explanations
This top graph shows the 3 different rates he mentioned. the 26.9, 12.0132, and 41.8692 hits to proc. below that I show the corresponding TH15 data as a histogram.  we can see that the data correlates better with the 12.0132 hit rate, as it peaks in that 1-11 bin, and has no peak in the 21-31 or 31-41 bins. But again low sample size could mean that Thorny just got really lucky to get so many low hits to proc values. There's no logical reason to assume it's anything other than the arithmetic mean, the margin of error should be used to show the range of possibilities, not make assumptions about the real value. It's reasonable to say that the actual rate could be as high as ~1/12 or as low as ~1/42, much less reasonable to assume it's any specific value besides 1/26.9 in absence of other data. The significance of the high amount of low procs is already self incorporated into the mean.
Shiva.Thorny said: » There's no logical reason to assume it's anything other than the arithmetic mean, the margin of error should be used to show the range of possibilities, not make assumptions about the real value. It's reasonable to say that the actual rate could be as high as ~1/12 or as low as ~1/42, much less reasonable to assume it's any specific value besides 1/26.9 in absence of other data. The significance of the high amount of low procs is already self incorporated into the mean. Assuming the rate is 3%, the probability you got 9 of your 17 procs in under 10 hits is 2.91388E-14  edited: mistake in order of `9/17` which should be `17/9` Shiva.Thorny said: » That isn't accurate math. Modeling for (9 or more) instances of a proc in less than 10 hits, at a 1/27 chance is going to be very complicated to actually write out. A simulation is comparatively easier, but still shows that it's nowhere near that unlikely:
Code
    local function TryRoll()
        local counts = T{};
        for i = 1,17 do
            local hitCount = 1;
            local proc = math.random(1, 27);
            while (proc ~= 1) do
                proc = math.random(1, 27);
                hitCount = hitCount + 1;
            end
            counts:append(hitCount);
        end

        local subTen = 0;
        for _,entry in ipairs(counts) do
            if (entry < 10) then
                subTen = subTen + 1;
            end
        end

        return (subTen >= 9);
    end

        local count = 0;
        local success = 0;
        while (success < 200) do
            if TryRoll() then
                success = success + 1;
            end
            count = count + 1;
        end

        print(string.format('Success rate:%u/%u', success, count));
Around 3% in practice, and that's also given the added significance you put on the 1-10 bucket arbitrarily. You could just as easily choose 8, or 12, or whatever. It's not a valid way to interpret data. if we assume 3% is the proc rate, the probability of procing in 10 or fewer its is 1 - (0.97^10) that being 26.25%, your data shows 52% of the data points fall in the group currently that is a large discrepancy
I'm not trying to be rude, but you're still choosing the number 10 yourself, that's not a data provided number. When you cherry pick a range like that, it's much easier to find erratic data, especially in a small sample like this. If you chose 15 instead, the numbers are much closer to expected (because there's less data than expected in 10-15 range). But, you can't just narrow down the dataset to a specific number that is visually appealing or seems significant, it's a form of biasing.
The reason mean and standard deviation exist is to provide these information points; modeling on #/hits was a good idea so that those would be available. Trying to pull data that doesn't exist by narrowing an already small sample even further doesn't work. Shiva.Thorny said: » I'm not trying to be rude, but you're still choosing the number 10 yourself, that's not a data provided number. When you cherry pick a range like that, it's much easier to find erratic data, especially in a small sample like this. The reason mean and standard deviation exist is to provide these information points; modeling on #/hits was a good idea so that those would be available. Trying to pull data that doesn't exist by narrowing an already small sample even further doesn't work. FWIW, the reason your math doesn't fit is because you're looking for 9 consecutive samples under 10 hits followed by 8 consecutive samples over. You have to remove the selection for order, and also the selection for exactly 9 (because it wouldn't be any less significant if more than 9 samples were that low). It gets complicated really quickly.
You can say it's relatively unlikely to have half the data points fall there, but with such a small sample we both know it's beyond meaningless. There's just only so much data you can get out of a sample that size, need to wait until more is in. Shiva.Thorny said: » FWIW, the reason your math doesn't fit is because you're looking for 9 consecutive samples under 10 hits followed by 8 consecutive samples over. You have to remove the selection for order, and also the selection for exactly 9 (because it wouldn't be any less significant if more than 9 samples were that low). It gets complicated really quickly. the flaw is that I did it for your chance of getting 9 procs on the first hit by using 3%, I should be using the 26.25% the total probability to proc between hits 1-10 Quote: (17/9) * (0.262575873)^9 * (1 - 0.262575873)^8 = 9.80028075830515E-07 Fenrir.Niflheim said: » with that the number is a more reasonable, and translates to odds just slightly better than 9:10 million which is still horribly wrong, because simulation sees it occur about 3% of the time (you can get into inaccuracies of random number generation, but that's not the difference between 1/33 and 1/9,000,000.. your calculations are wrong) Quote: (0.262575873)^9 Shiva.Thorny said: » Quote: (0.262575873)^9 This is inherently looking for consecutive outcomes, because you're multiplying the chance against itself without compensating for the alternate orders of events. Then, you're further multiplying against another probability of consecutive outcomes. I have no idea why you think multiplying by 17/9 does anything to fix that. binomial probability Google said:  yes, that's the equation
no, you are not using it correctly.. the first multiplier is the number of possible combinations in the set not a fraction.. further, to represent 9 or more you have to repeat the calculation for 10/7, 11/6, 12/5.. and add them all up Shiva.Thorny said: » yes, that's the equation no, you are not using it correctly.. the first multiplier is the number of possible combinations in the set not a fraction.. further, to represent 9 or more you have to repeat the calculation for 10/7, 11/6, 12/5.. and add them all up You are comparing the shaded area to the non-shaded area, that is how it accounts for all of the other probabilities, and why we do not need to do the same equation for 10/7  You're using 17/9 when it should actually be this:
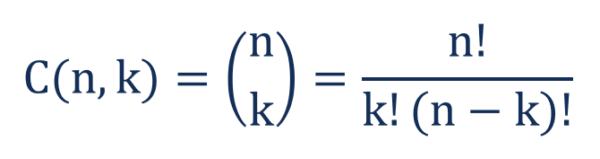 17! / 9! * 8! = 24310 24310 * (0.262575873)^9 * (1 - 0.262575873)^8 = 1.2612% 17! / 10! * 7! = 19448 19448 * (0.262575873)^10 * (1 - 0.262575873)^7 = 0.3592% 17! / 11! * 6! = 12376 12376 * (0.262575873)^11 * (1 - 0.262575873)^6 = 0.0814% All the way up, then add them up. It's around 2% when calculated instead of simulated. I'm not talking about whether it takes exactly 10 hits or less, I'm saying that you're looking for 9 or more instances of a proc in under 10 hits not exactly 9 instances of a proc in under 10 hits and your probability needs to represent that. This is tedious.
[+]
Shiva.Thorny said: » You're using 17/9 when it should actually be this: 17! / 9! * 8! = 24310 24310 * (0.262575873)^9 * (1 - 0.262575873)^8 = 1.2612% 17! / 10! * 7! = 19448 19448 * (0.262575873)^10 * (1 - 0.262575873)^7 = 0.3592% 17! / 11! * 6! = 12376 12376 * (0.262575873)^11 * (1 - 0.262575873)^6 = 0.0814% All the way up, then add them up. It's around 2% when calculated instead of simulated. I'm not talking about whether it takes exactly 10 hits or less, I'm saying that you're looking for 9 or more instances of a proc in under 10 hits not exactly 9 instances of a proc in under hits and your probability needs to represent that. This is tedious. The equation i posted should have been Excel Formula said: =((FACT(17) / (FACT(9) * FACT(17 - 9))))*(1 - 0.262575873)^9*(0.262575873)^8 It happens. The reason it's done that way is to account for orders, which is what I tried to explain. k! is the amount of orders the successful rolls can be in, while (n-k)! is the amount of orders the failure rolls can be in. Multiply them together to get the total amount of potential fitting orders. Divide the total number of outcomes that exist(n!) by the number of fitting outcomes to get the scale that has to be applied to your check (which is the chance of X consecutive success rolls followed by Y consecutive failure rolls).
And, just to be abundantly clear: Quote: =((FACT(17) / (FACT(9) * FACT(17 - 9))))*(0.262575873)^9*(1 - 0.262575873)^8 You would need to also add the chance of 10/17: Quote: =((FACT(17) / (FACT(10) * FACT(17 - 10))))*(0.262575873)^10*(1 - 0.262575873)^7 and the chance of 11/17: Quote: =((FACT(17) / (FACT(11) * FACT(17 - 11))))*(0.262575873)^11*(1 - 0.262575873)^6 Shiva.Thorny said: » And, just to be abundantly clear: Quote: =((FACT(17) / (FACT(9) * FACT(17 - 9))))*(1 - 0.262575873)^9*(0.262575873)^8 is the chance of EXACTLY 9/17 coming in under 10 strikes. :/ also another oops. got the 1 - p on the wrong side there in that last post. At any rate, I eagerly await more data. I always find this type of activity the most fun. |
|||||||||||||||||||||||||||||||||||||
|
All FFXI content and images © 2002-2026 SQUARE ENIX CO., LTD. FINAL
FANTASY is a registered trademark of Square Enix Co., Ltd.
|
|||||||||||||||||||||||||||||||||||||